Esta página destina-se apenas a fins informativos. Certos serviços e funcionalidades podem não estar disponíveis na sua jurisdição.

How to Use Value at Risk (VaR) to Manage Your Cryptocurrency Assets

The crypto market is known for its extreme volatility, where the price of cryptocurrencies can vigorously fluctuate within a short period of time. In a market full of uncertainty, managing risks is therefore crucial for any traders, only by analyzing the possible risks of investments can traders determine the extent and occurrence ratio of potential losses in their portfolios.

To evaluate portfolio risk, we can make use of different tools in the market to calculate the “worse-case scenario” in trading, such as Value at Risk (VaR).

Understanding Value at Risk (VaR)

Dubbed the “new science of risk management”, Value at Risk (VaR) is a statistic that measures and quantifies the level of financial risk within a firm, a portfolio or a position over a specific time frame. It can be applied to measure the risk exposure of specific positions or whole portfolios.

A VAR statistic has three components: a time period, a confidence level and a loss amount (or loss percentage). Let’s look at an example of using VaR to calculate risks.

BTC/USDT: VaR Calculation

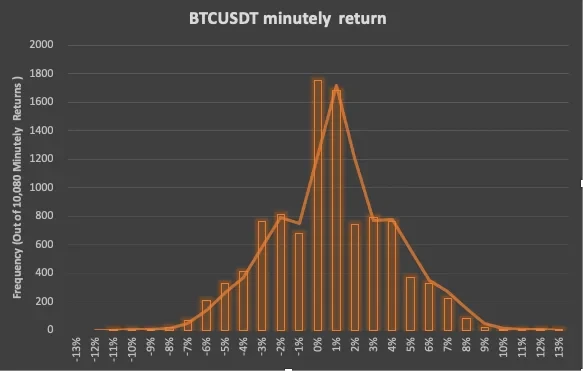
We will focus on the minute closing price of BTC/USDT between Aug 15–21, 2019 on OKX. This calculation assumes that log-returns are normally distributed.

Step 1: Calculate the minute log-returns

Minute log-returns can be calculated based on the below formula:

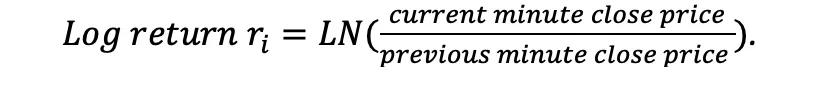
Here we use the logarithm of returns instead of price returns. The benefits of using log-returns, versus prices, is log-normality: assuming the prices are distributed log normally, the log return is conveniently normally distributed, which is handy given much of classic statistics presumes normality.

We can then divide the log-returns into 27 intervals: (-14%, -13%), (-12%, -11%), …, (12%, 13%), count the number of minute returns for each interval and we get the following histogram:

Step 2: Calculate the average and standard deviation of log returns

We can then calculate the average and standard deviation of log-returns based on the formulas:

The average (µ) of 10,080-minute log-returns turns out to be 0.001083%, and the standard deviation (σ) is 0.03170.

Step 3: Calculate VaR based on confidence intervals of normal distribution

Assuming the returns are normally distributed, we can see where do the worst 5% and 1% lie on the normal curve. They show trader’s desired confidence, the standard deviation and the average from the below table:

The Verdict

There are two ways to understand the VaR calculation results:

  • With 95% and 99% confidence, we can expect that the worst loss will not exceed 5.23% and 7.38% respectively;
  • If we invest $10,000, we are 95% and 99% confident that our worst minute-loss will not exceed $523 (=$10,000 x -5.23%) and $738 (=$10,000 x -7.38%) respectively.

VaR is useful for calculating the maximum expected loss on an investment over a given time and a specified degree of confidence. Traders can apply VaR to determine the level of risk or potential losses of their trading portfolios easily and hence take necessary measures to control the risks.

Aviso legal
Este conteúdo é fornecido apenas para fins informativos e pode abranger produtos que não estão disponíveis na sua região. Não se destina a fornecer (i) aconselhamento ou recomendações de investimento; (ii) uma oferta ou solicitação para comprar, vender ou deter ativos de cripto/digitais, ou (iii) aconselhamento financeiro, contabilístico, jurídico ou fiscal. As detenções de ativos de cripto/digitais, incluindo criptomoedas estáveis, envolvem um nível de risco elevado e podem sofrer grandes flutuações. Deve ponderar cuidadosamente se o trading ou a detenção de ativos de cripto/digitais são adequados para si, tendo em conta a sua situação financeira. Consulte o seu profissional jurídico/fiscal/de investimentos para tirar dúvidas sobre as suas circunstâncias específicas. As informações (incluindo dados de mercado e informações estatísticas, caso existam) apresentadas nesta publicação destinam-se apenas para fins de informação geral. Embora tenham sido tomadas todas as precauções razoáveis na preparação destes dados e gráficos, a OKX não assume qualquer responsabilidade por erros ou omissões aqui expressos.

© 2025 OKX. Este artigo pode ser reproduzido ou distribuído na sua totalidade, ou podem ser utilizados excertos de 100 palavras ou menos deste artigo, desde que essa utilização não seja comercial. Qualquer reprodução ou distribuição do artigo na sua totalidade deve indicar de forma clara: “Este artigo é © 2025 OKX e é utilizado com permissão.” Os excertos permitidos devem citar o nome do artigo e incluir a atribuição, por exemplo, "Nome do artigo, [o nome do autor, caso aplicável], © 2025 OKX." Alguns conteúdos podem ser gerados ou ajudados por ferramentas de inteligência artificial (IA). Não são permitidas obras derivadas ou outros usos deste artigo.

Artigos relacionados

Ver mais
9 Best AI Crypto Trading Bots To Use in 2024 Cover
Strategies

What are Telegram trading bots: how to trade crypto in Telegram

Blink and you’ll miss it. That’s how quickly some potential crypto trading opportunities can seemingly pass you by if you’re new to the crypto trading scene. Fortunately, many crypto trading tools today help ease beginners into the process of and navigating the onchain trading process. Enter Telegram trading bots: the new kid on the block that’s become increasingly popular among crypto enthusiasts because of the unmatched convenience on offer.
21/11/2025
Intermédio
21
trade-academy-spot-3
Bitcoin
Strategies

Bitcoin Rainbow Chart: A Concise Overview and User Guide

If you wish to become a professional trader or investor, you have to learn how to use trading tools. This is the only way to be able to predict the price accurately and make educated moves. Otherwise,
21/11/2025
1
Generic tokens thumbnail
Bitcoin
Technical analysis
Strategies

How to short Bitcoin: a step-by-step guide to short-selling BTC

With its limited supply, protocol-regulated rate of issuance, and generally rising popularity and demand, Bitcoin has — over the decade or so of its existence — managed to outperform typical assets by a large margin. However, this long-term price appreciation hasn't happened without sharp drops and several bearish phases along the way.
21/11/2025
Intermédio
42
Cyberpunk trading generic
Strategies
Order Types

What is margin? Leverage your crypto trades for amplified results

There's no shortage of exciting possibilities in crypto. For the crypto-curious, the potential for significant returns can be incredibly enticing. But what if there was a way to amplify your gains (or losses) in the market? Enter margin trading and leverage, both powerful tools that can supercharge your returns — but also magnify your risks.
21/11/2025
Avançado
38
Crypto adoption generic thumbnail
Strategies

Crypto vs forex trading: which is right for you?

Cryptocurrency trading and forex trading are two popular investment options in the financial world. Cryptocurrency trading involves buying and selling digital currencies like Bitcoin, Ethereum and Litecoin on a decentralized digital exchange.
21/11/2025
14
Options trading generic thumb
Technical analysis

How to read candlestick charts for effective crypto trading

Candlestick charts are a popular type of financial chart traders use to analyze price movements in various markets, including cryptocurrencies. They were initially developed by Japanese traders in the 18th century and are now widely used across the world.
21/11/2025
Iniciantes
255
Ver mais